Drone orchard scanning · Stanislaus & Merced

See every tree. Catch every problem.

One drone flight with a color camera and a multispectral camera. Every tree counted, every gap pinned by GPS, and every stressed tree flagged before you can see it from the truck — all in a map on your phone.

FAA Part 107 certified · Insured · 2 cm imagery
Drone map of an orchard with a missing tree and three weak trees marked, and a GPS path to the missing tree
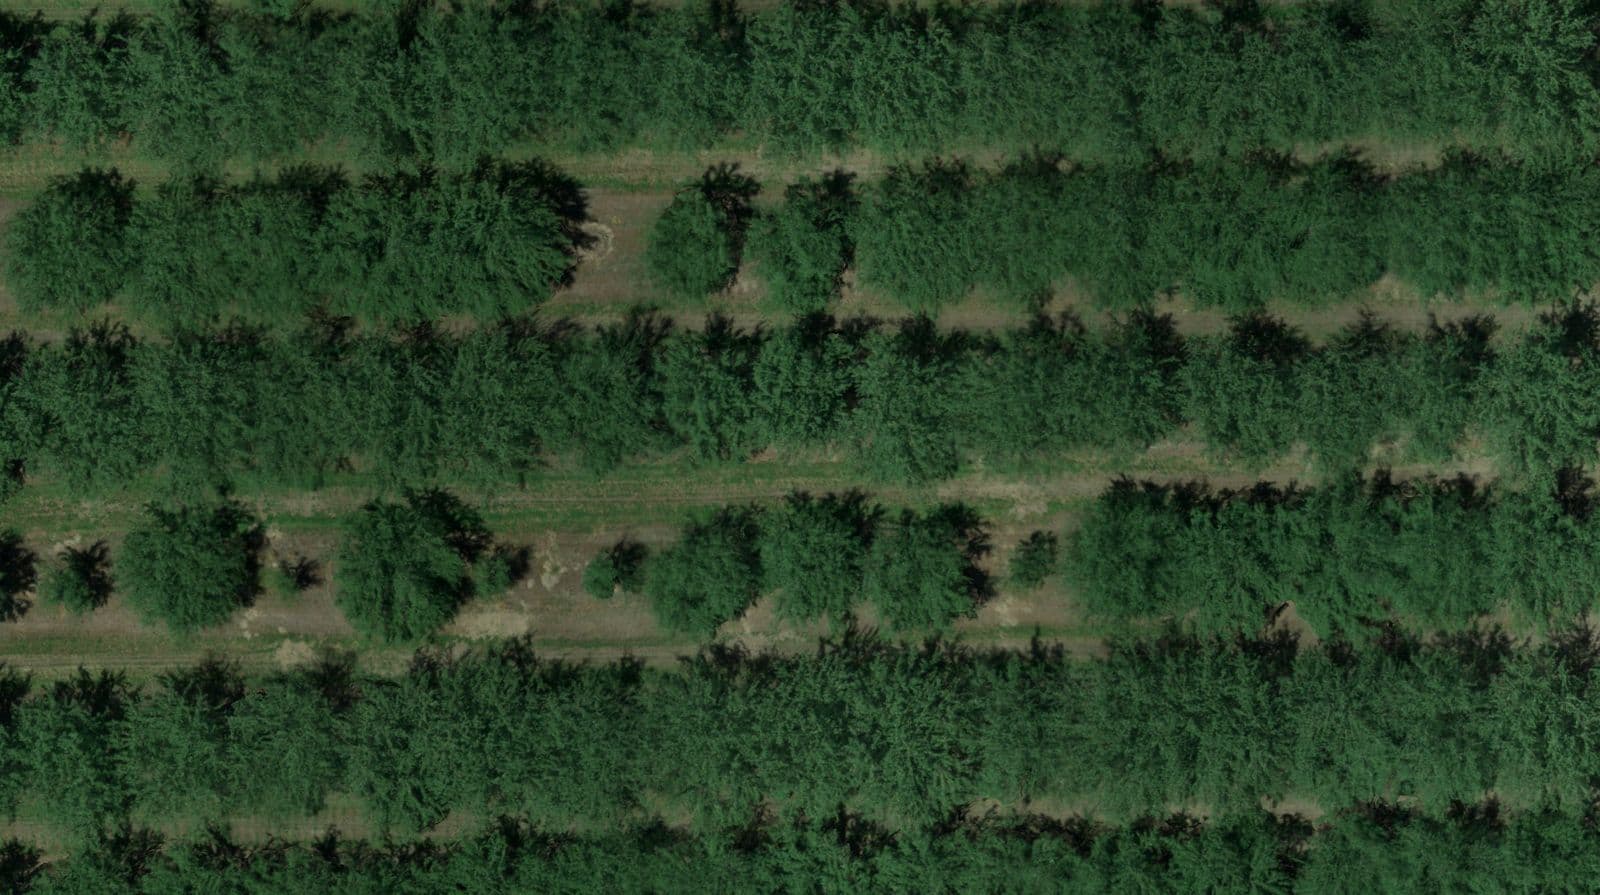
Color map
Missing treeWeak treeYou, on live GPS

Two cameras. One flight. Nothing hidden.

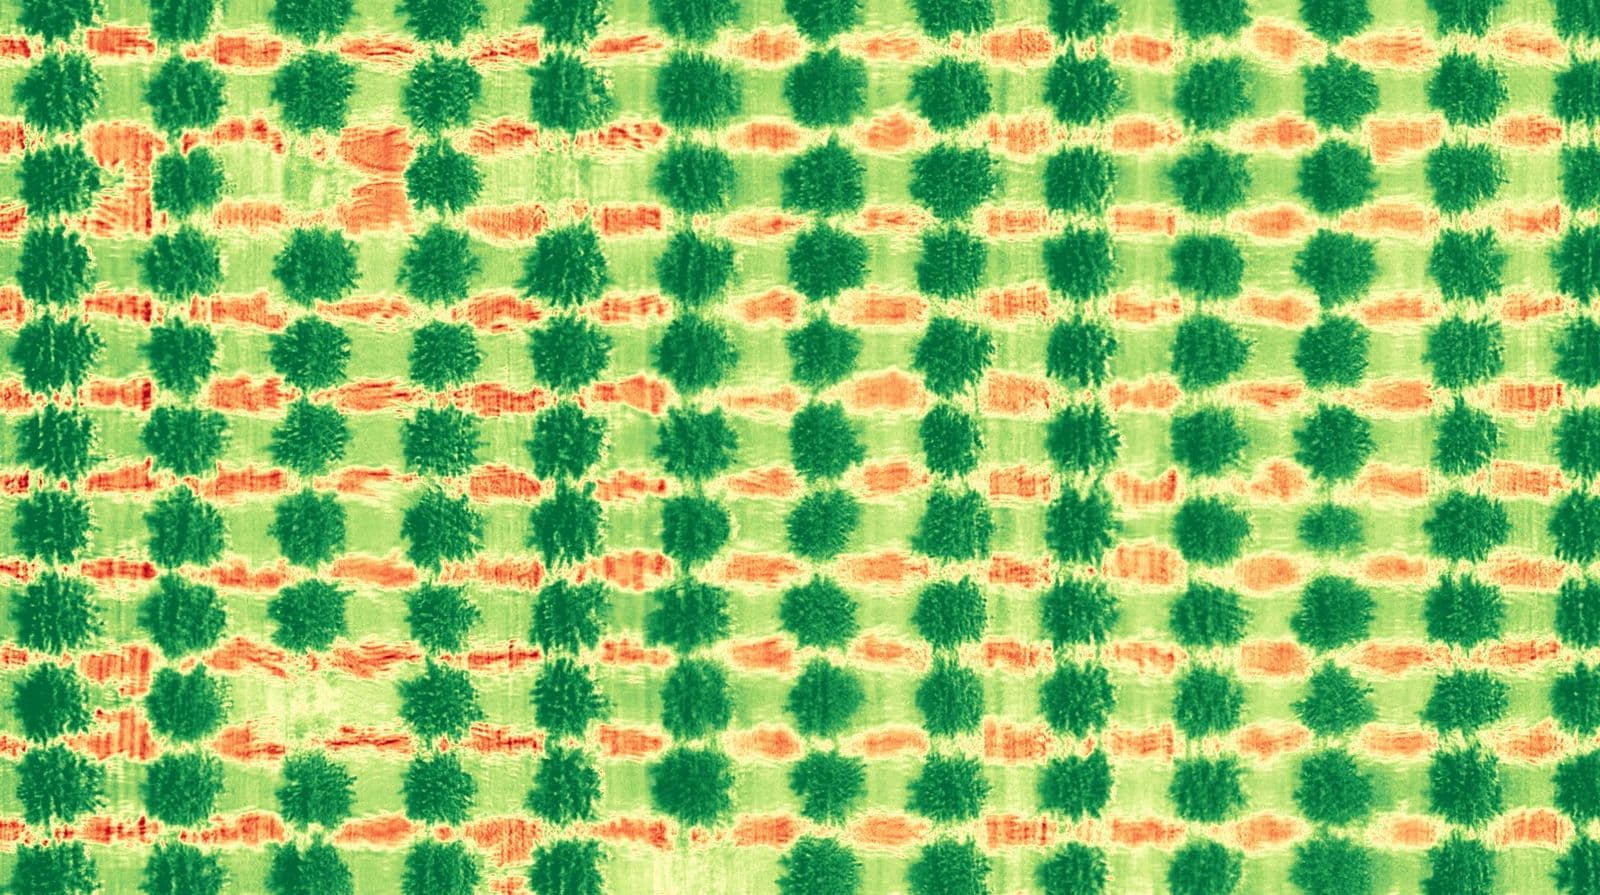
The color map shows you where every tree is — and isn't. The multispectral camera reads plant health the eye can't, so stress, dry spots and failing trees show up early.

Multispectral NDVI plant-health map of a young orchard, with three missing trees ringed
Multispectral · NDVI

Plant health, tree by tree

Bare ground / missingStressedHealthy

What you get from one flight

Everything below comes from the same morning over your block.

01 · Color map

Counts, gaps & replants

  • Tree counts

    Exact numbers by block and by row.

  • Missing trees & replant list

    A GPS pin on every gap, and the number to order from the nursery.

  • Replant check

    Fly it again next season and see exactly which replants took.

  • New-planting stand counts

    Count every tree right after planting.

  • Acreage & boundary maps

    2 cm maps of the whole block. Measure rows, distances and acres.

02 · Multispectral

Plant health, tree by tree

  • Stressed & dying trees

    Weak trees flagged weeks before they show from the ground.

  • Irrigation problems

    Dry spots, failing lines and uneven water show up as patterns.

  • Multispectral health maps

    NDVI and other plant-health layers for the whole block.

  • Problem zones outlined

    Weak areas drawn on the map so your crew knows where to look.

  • Track the season

    Repeat scans show whether a block is recovering or slipping.

03 · On your phone

Walk straight to the problem

  • Your own online map

    Every scan lands in a private map on your phone, iPad or computer.

  • GPS to the tree

    Tap a pin and your phone guides you there. Mark it, fix it, check it off.

  • Spray & fertilizer zones

    Zone maps you can export for variable-rate application.

  • Logins for your team

    Give your foreman, PCA or manager their own access.

  • Land sales & appraisals

    Verified tree counts for buyers, sellers and appraisers.

The problems you can't see from the truck

A missing or failing tree costs you every single year until it's replaced. Most growers are off by more than they think.

The math on a 100-acre almond block

Average California yield
1,940 lb/acre
3% of trees missing = 3 acres idle
~5,800 lb/yr
Grower price, 2025 average
$2.60/lb
Lost every year
~$15,000

USDA 2026 yield forecast · Nonpareil above $3/lb in 2026

Replant orders are due before December

Nurseries dig bareroot trees December through February. Get your count now, while the leaves are still on and dying trees still show.

Get my count

How it works

1

Request a scan

Fill in the form or call or text. Tell us the block and the nearest crossroads.

2

We fly it

One morning, from the field edge. Nobody in your rows, nothing in your way.

3

Open your map

Counts, pins and plant-health layers in your own portal, ready to use.

First block scanned free

No contract. You keep the count and the map either way. Tell us a little about the block and Reece will reach out to set up a morning to fly it.

FAA Part 107 certified · Insured · Local

Leave a phone number or an email — whichever you'd rather be reached at.